The Geography of India's Carbon Market
Seven sectors, roughly 490 entities, have final GHG emission intensity targets, notified in two phases between October 2025 and January 2026: cement, textile, chlor-alkali, pulp and paper, petroleum refining, petrochemicals, and aluminium. A draft notification in June 2026 brought iron and steel into the scheme as well, another 255 units, subject to an objection window before it is finalised.
That is over 700 obligated entities: the compliance backbone of an intensity-based emissions trading system covering a large share of India's industrial emissions.
This is a market usually discussed in percentages, sector names, and registration numbers. Rarely in places. So I mapped where the entities actually are.
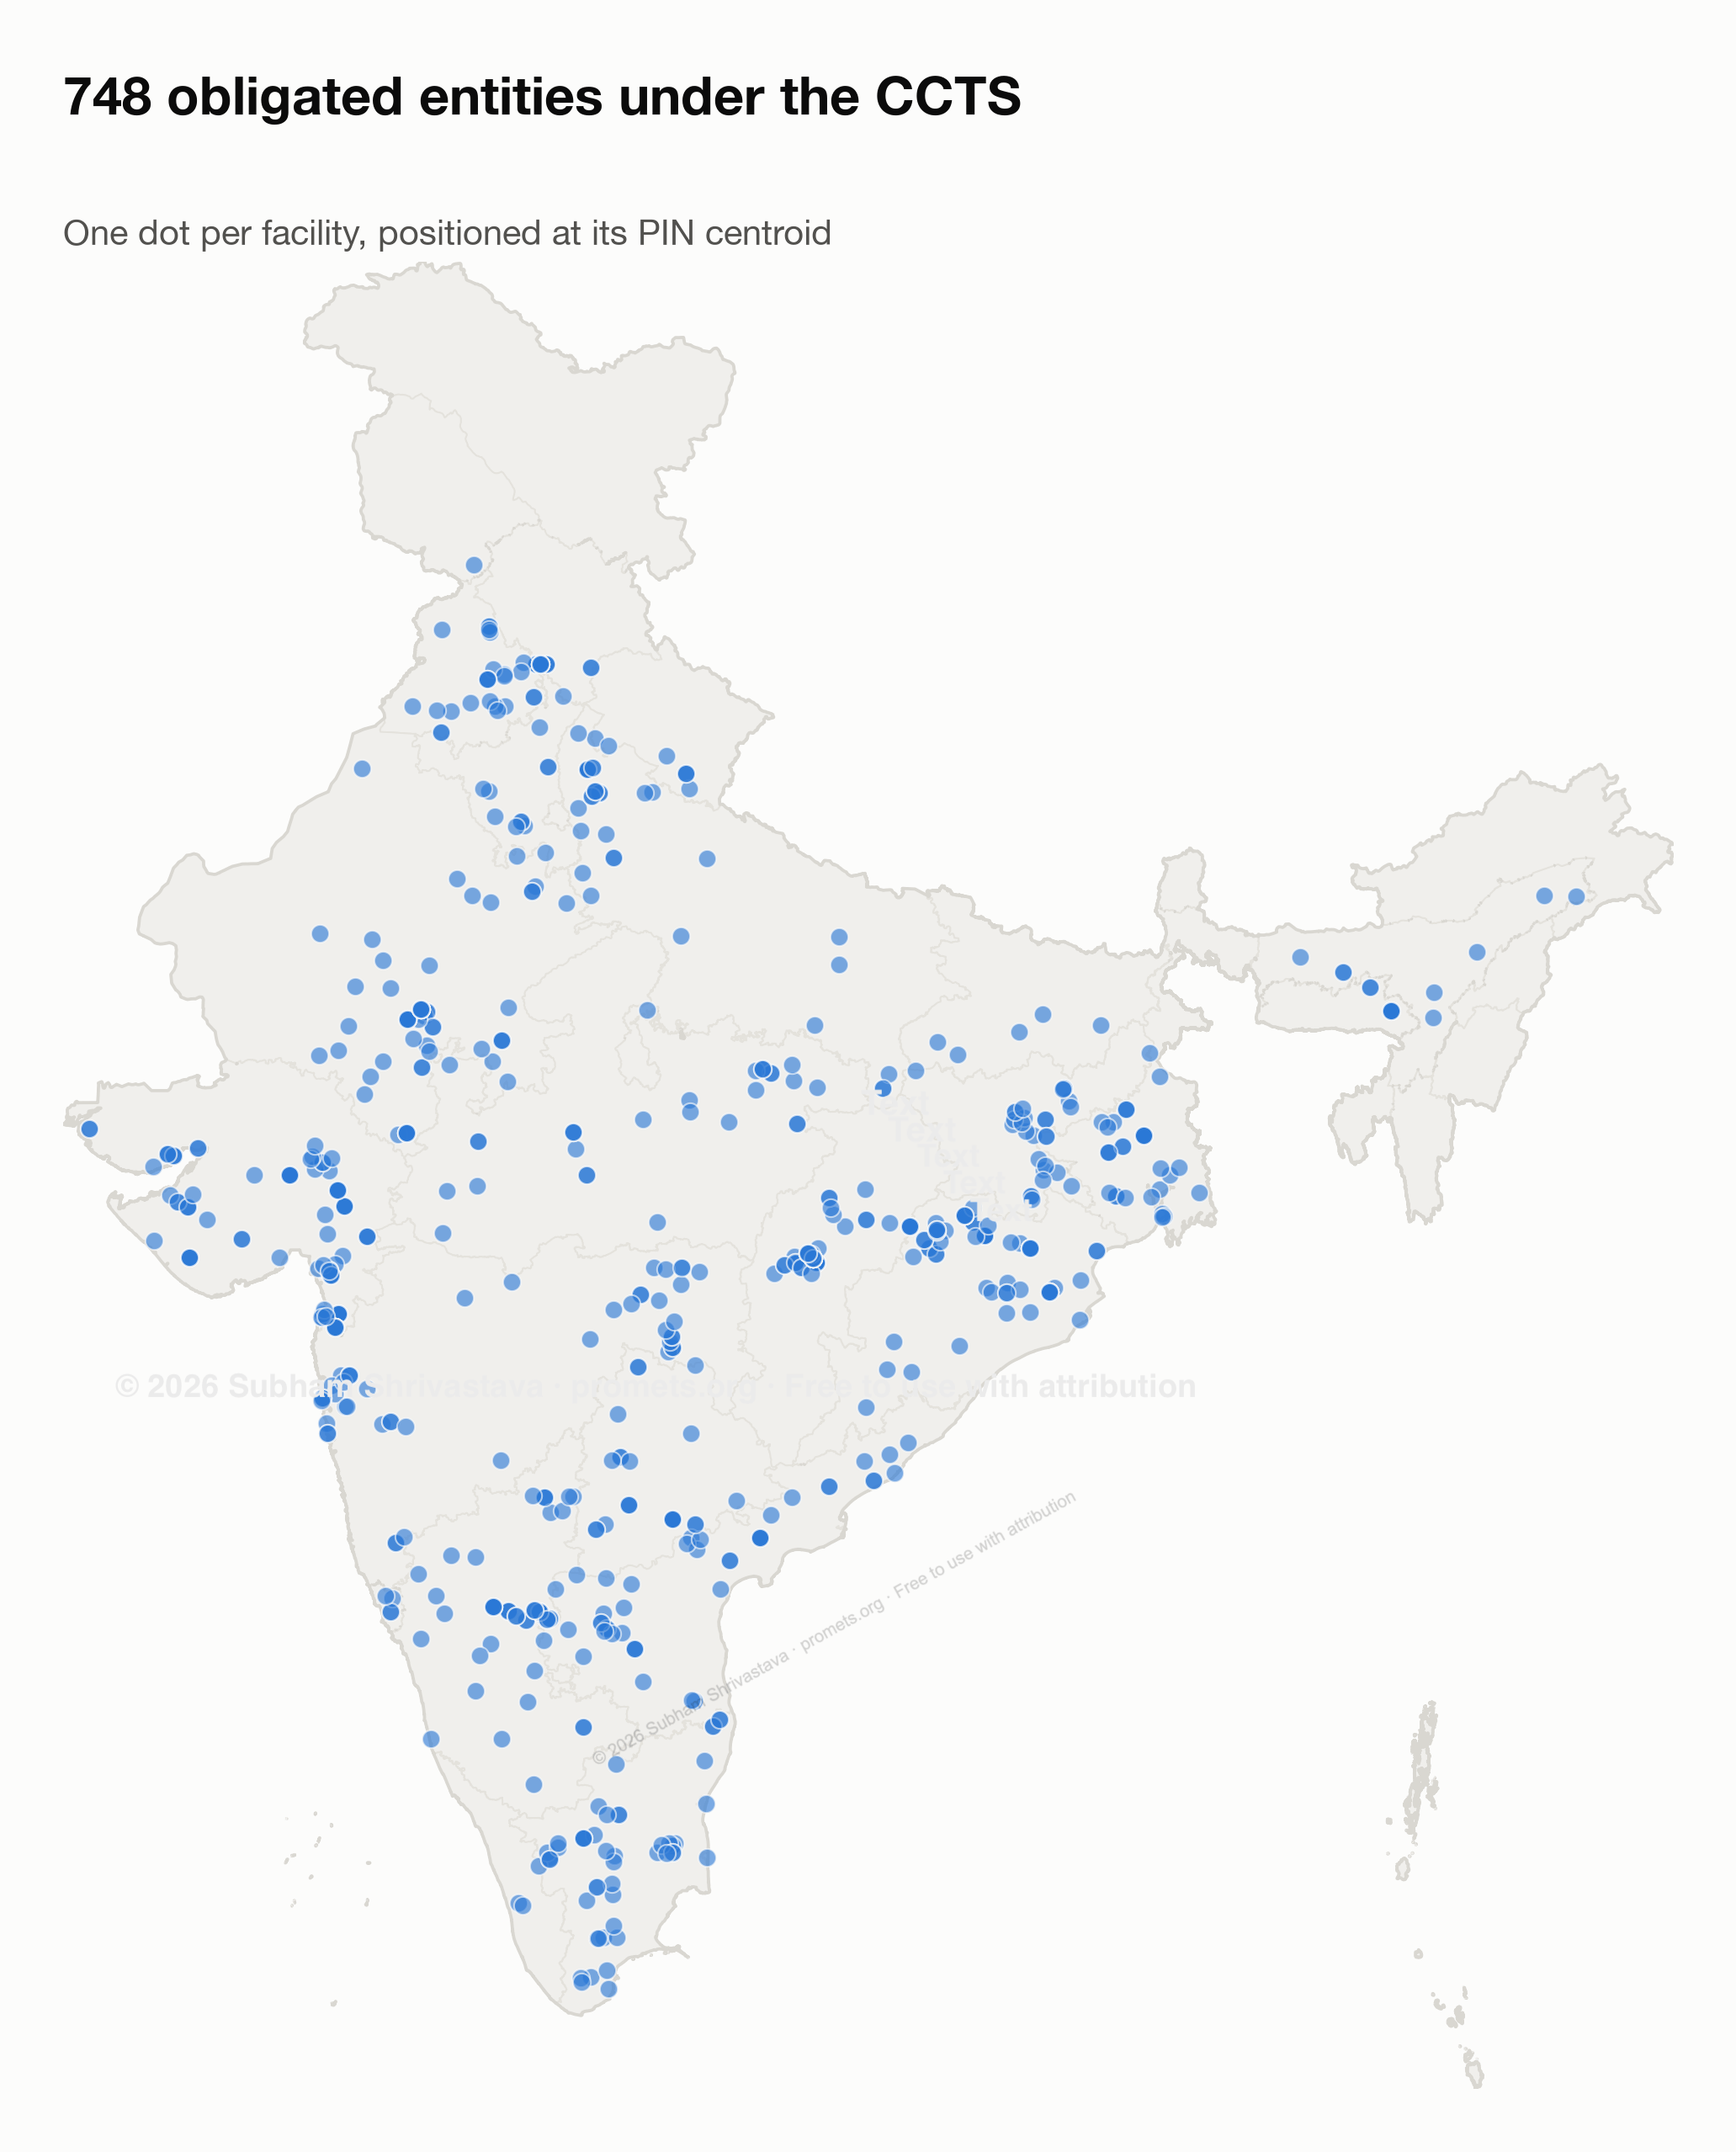
First, simply where they are.
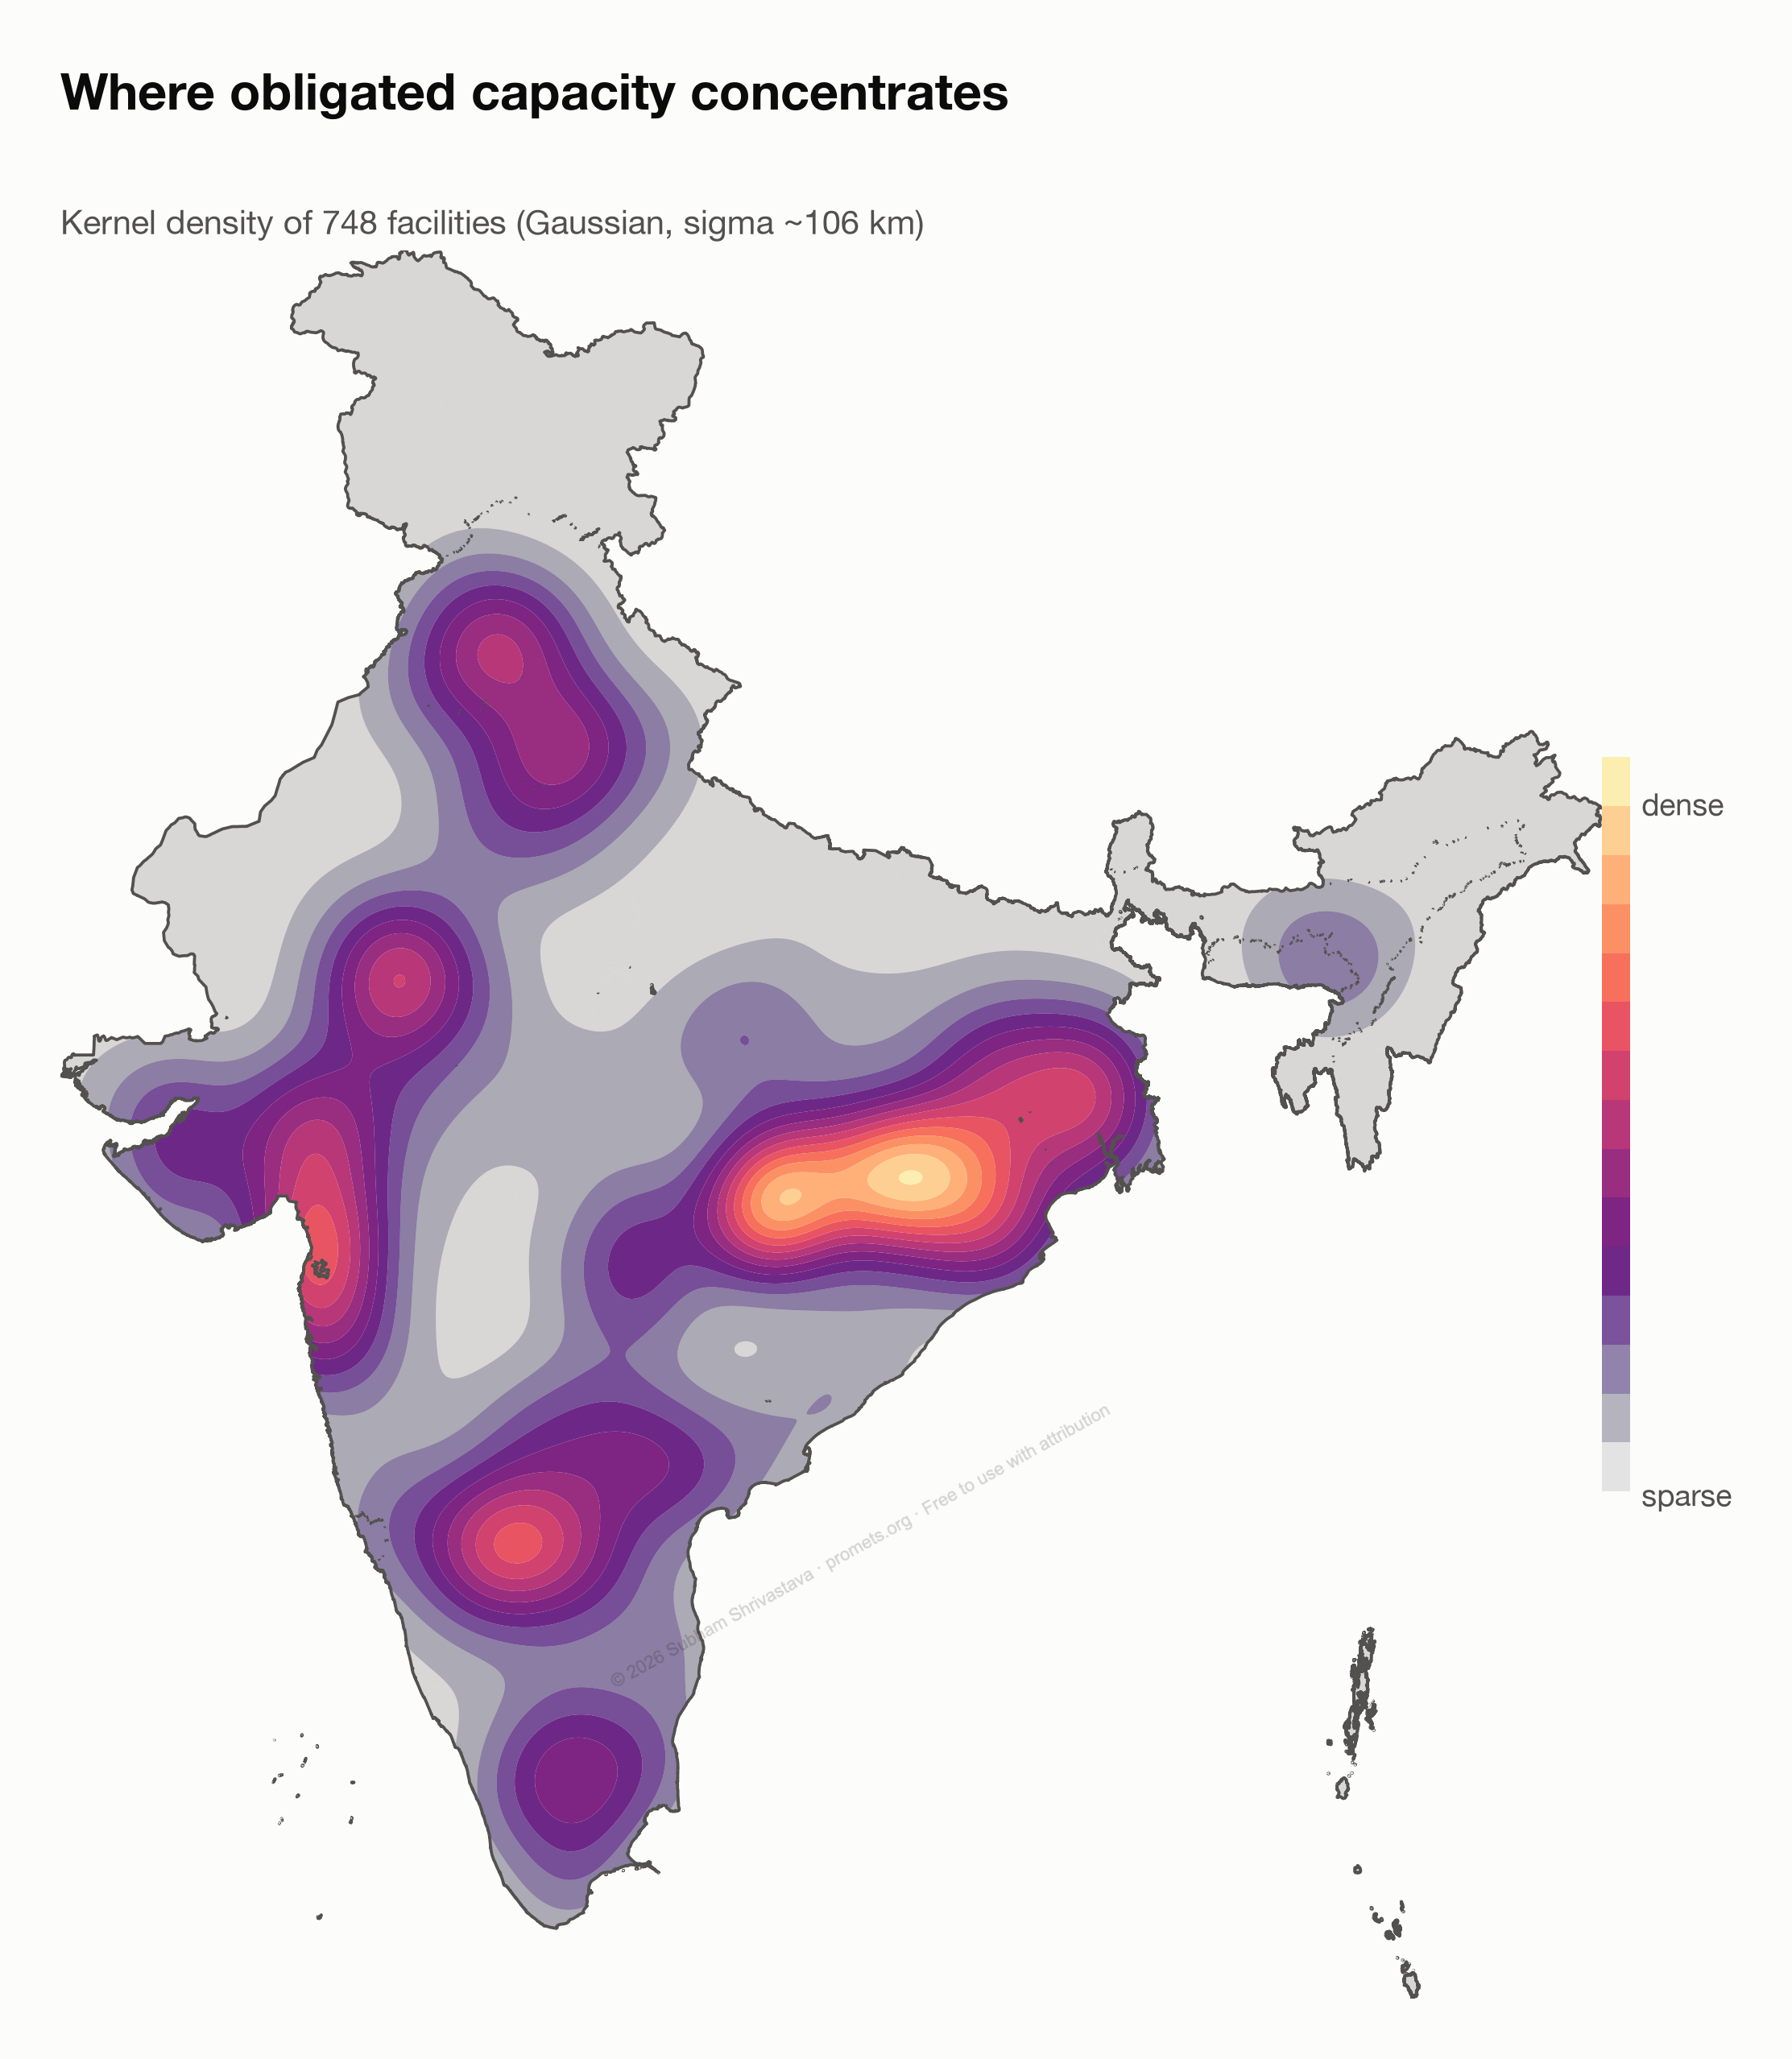
The same distribution as density rather than points, which makes the clusters easier to read.
Where the compliance pressure sits
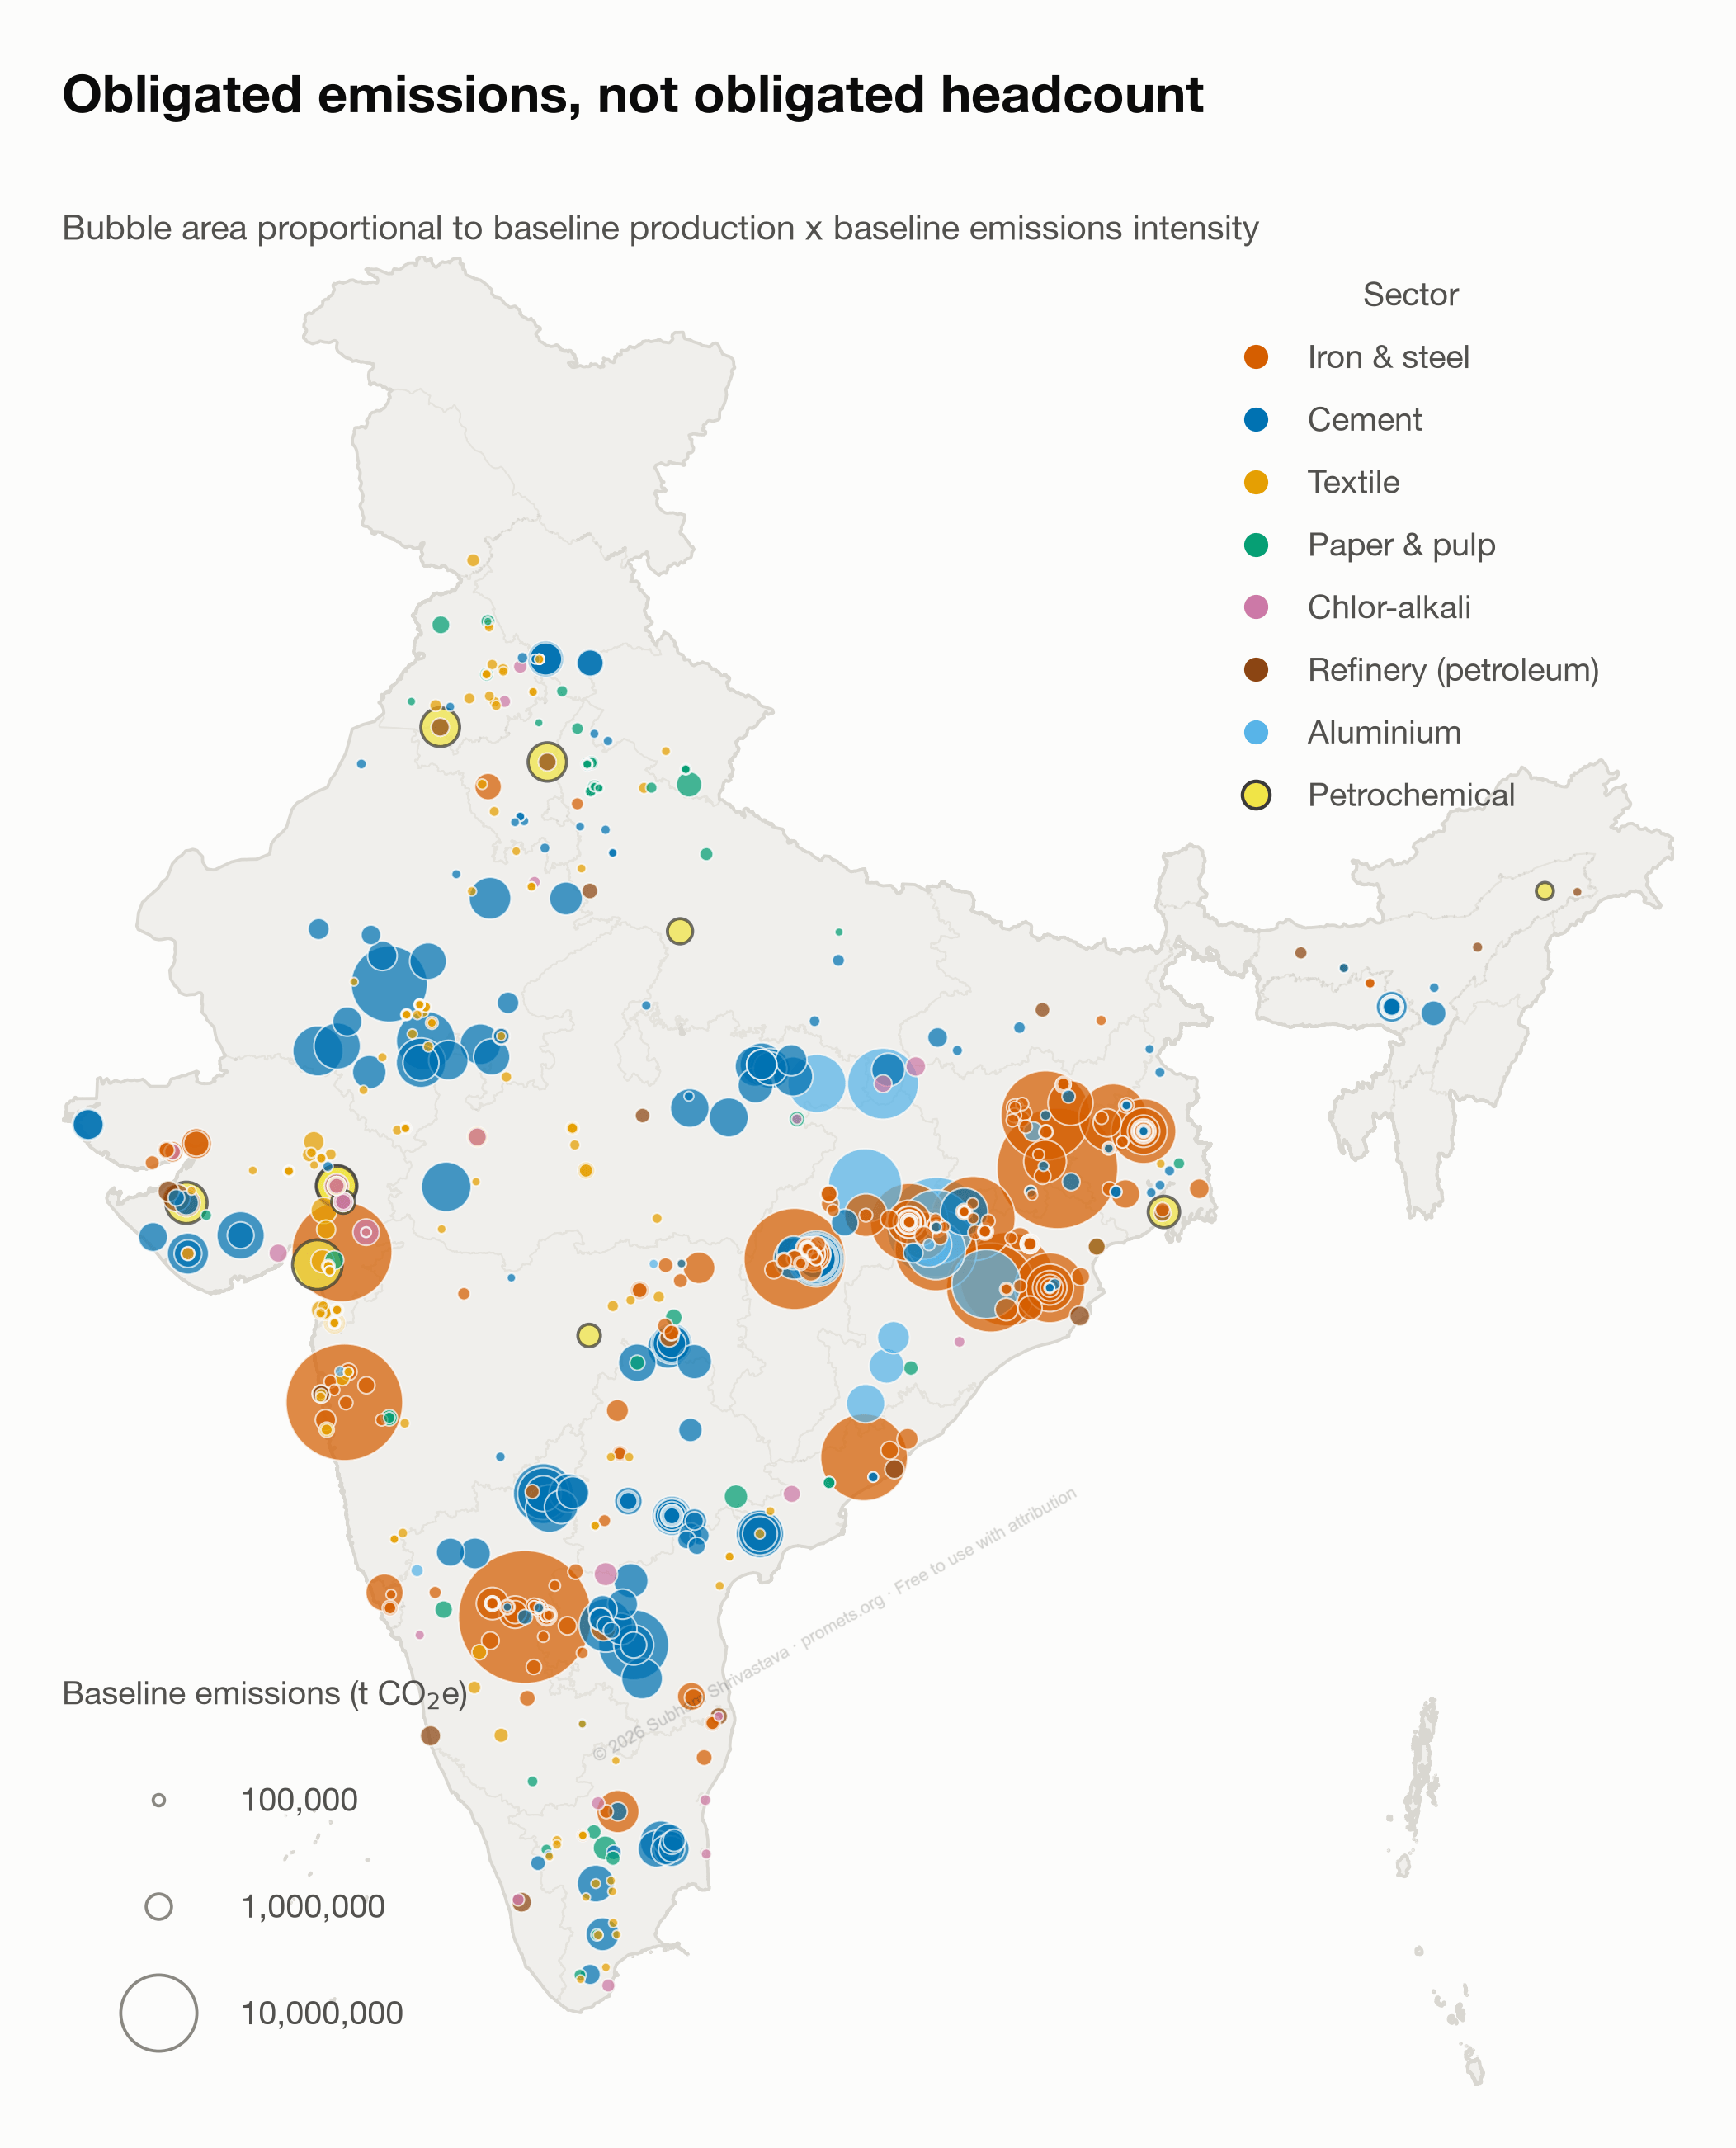
This map weights entities by baseline emissions rather than counting them. Counting entities tells you where the paperwork is; weighting by baseline emissions tells you where the compliance and abatement pressure in this market is actually concentrated. Those are not the same picture.
How obligations spread across sectors
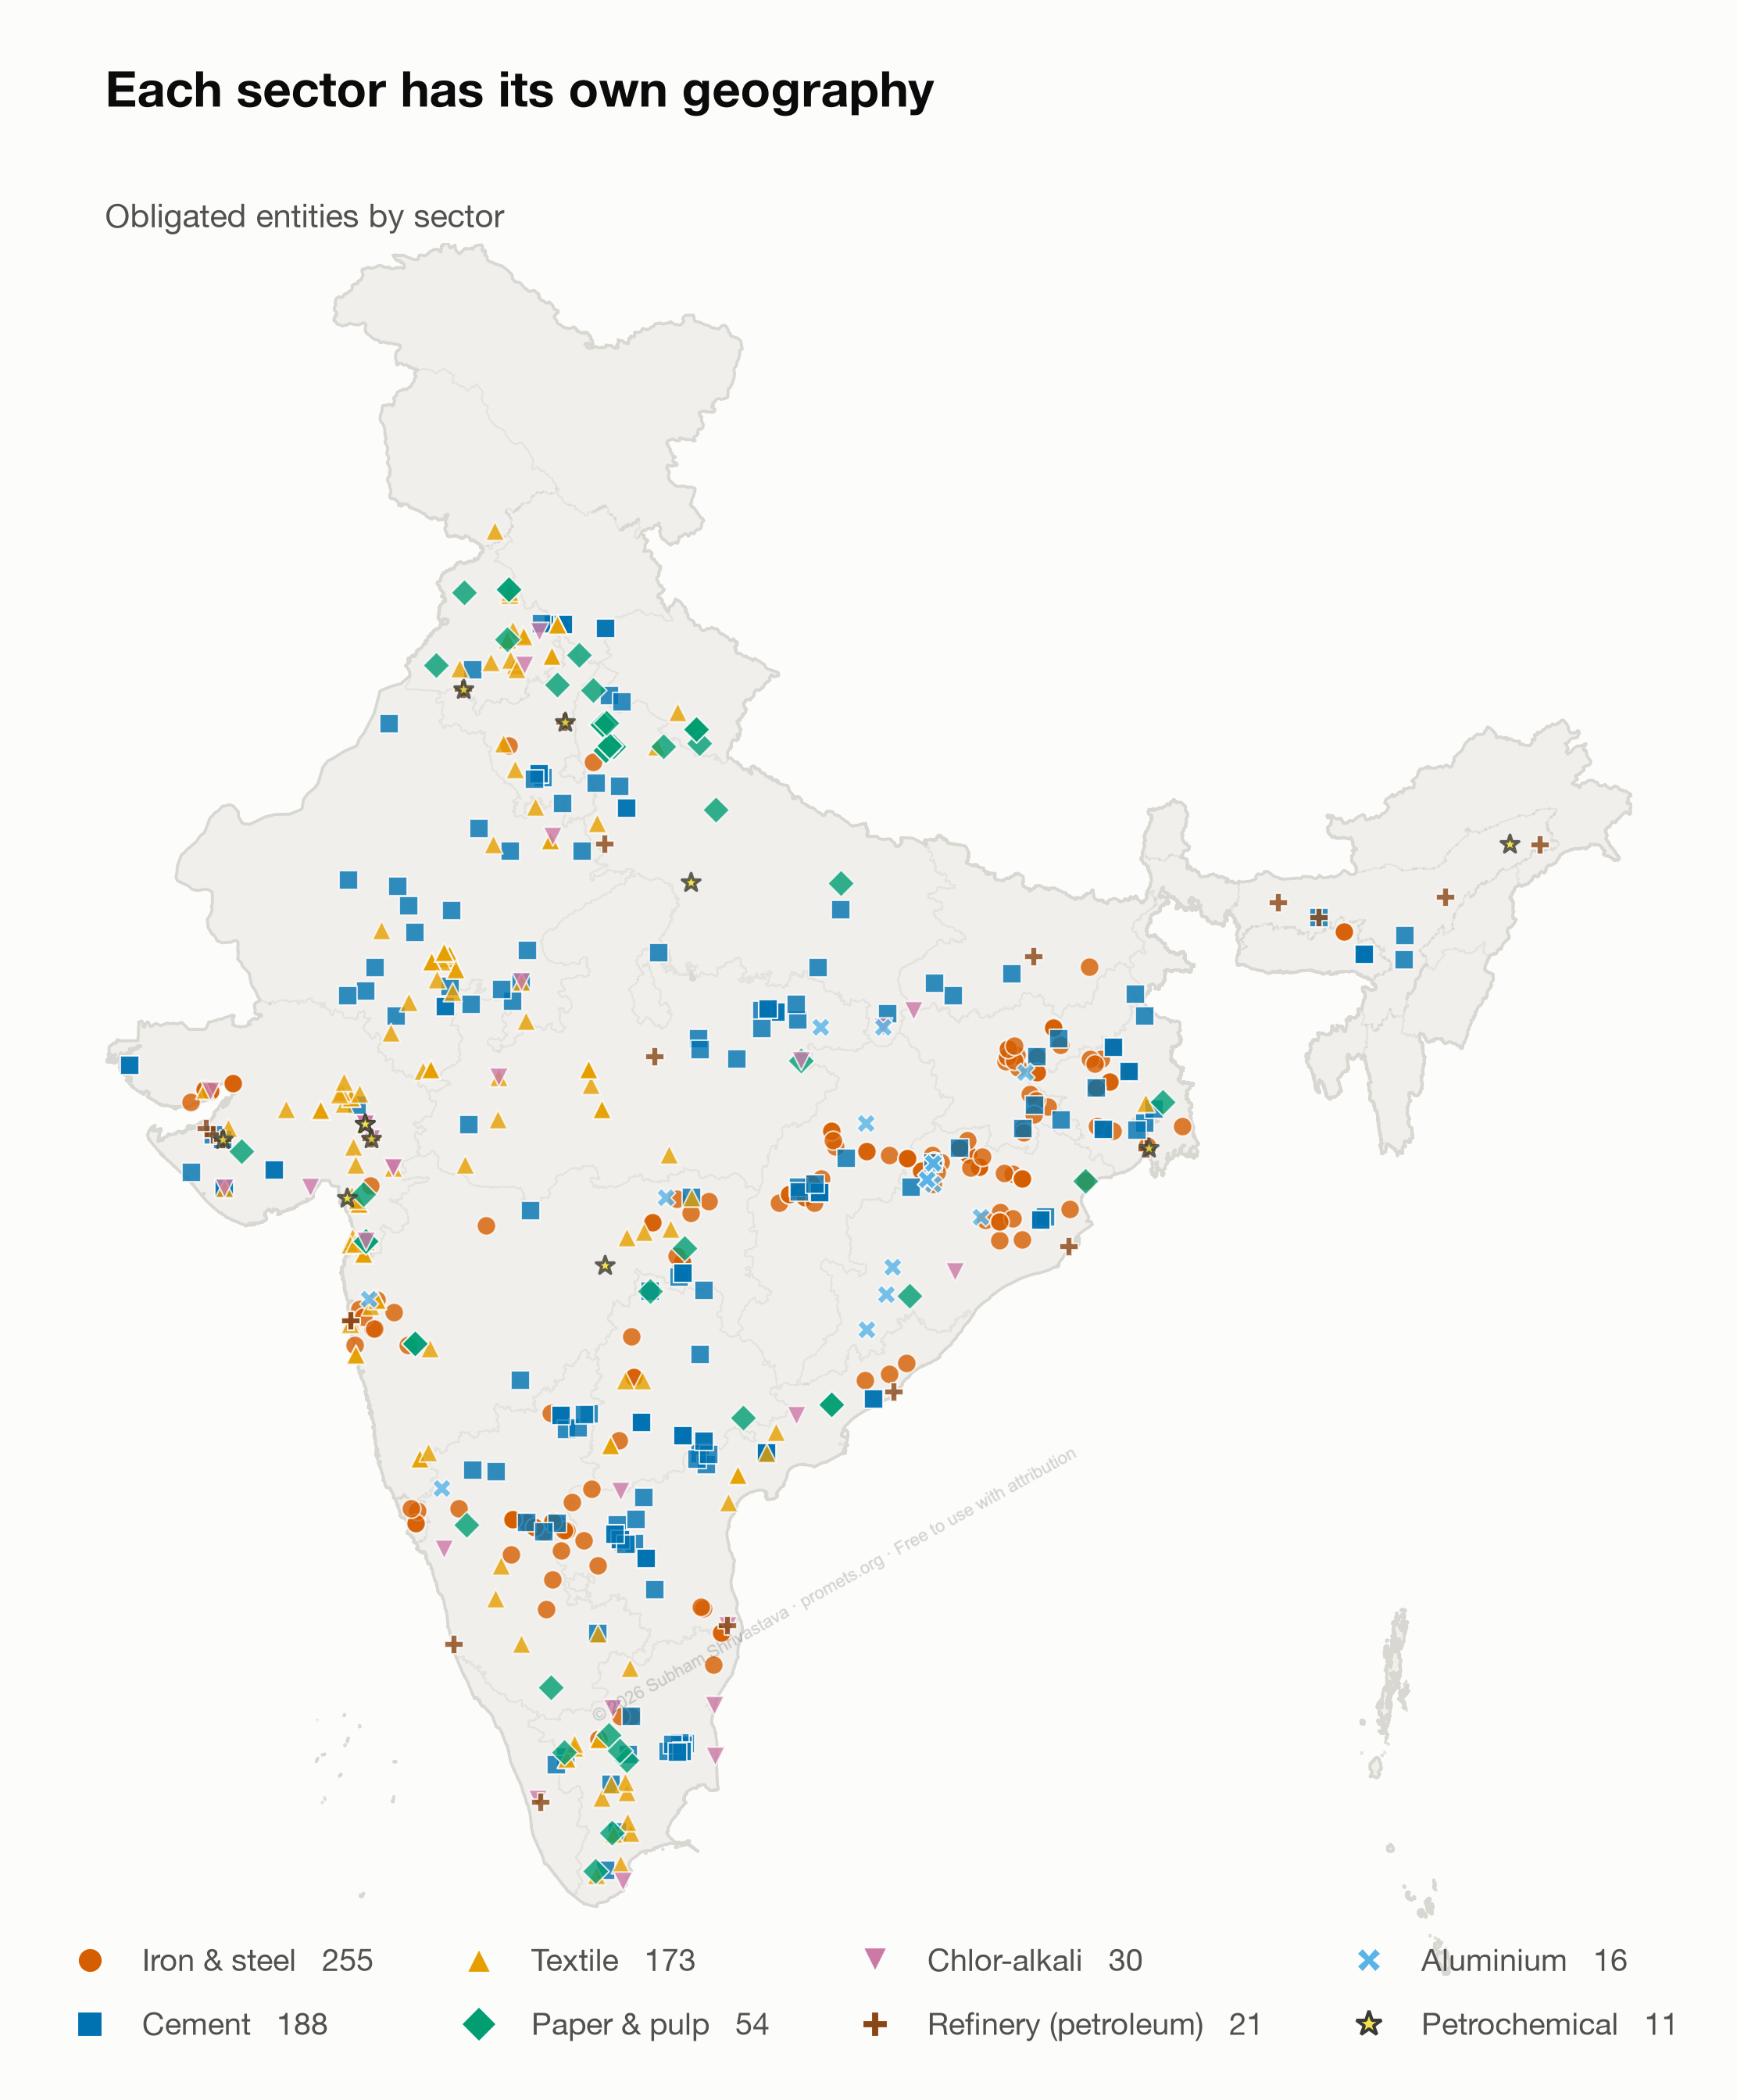
This map shows the spread of compliance obligations across the country, sector by sector.
Where entities cluster, you get the usual agglomeration effects: shared power and fuel markets, common suppliers, similar regulatory environments. On top of those, there is a carbon-market-specific one. MRV and verification capacity, accredited carbon verification agencies, auditors, and carbon accounting expertise builds up around dense clusters the same way any professional service agglomerates near demand.
Why spatial concentration matters in a baseline-and-credit market
The CCTS is a baseline-and-credit system. Obligated entities are assessed against their own emission intensity target, and the quantity of credits generated or owed is linked to both the intensity gap and the entity's output. That makes the spatial concentration of obligated entities relevant to how the market actually behaves.
Industrial clusters often share technology ecosystems, suppliers, infrastructure, and fuel access. So the diffusion of a new efficiency technology or fuel-switching option within a cluster can produce correlated intensity improvements across several entities at once.
Credit generation and compliance demand can then move together within a cluster rather than evolving independently across the 700-plus entities in the scheme. That has implications for how concentrated, and how volatile, credit supply and demand end up being.
You can see how correlated abatement affects a market by running one yourself in the ETS Sandbox.
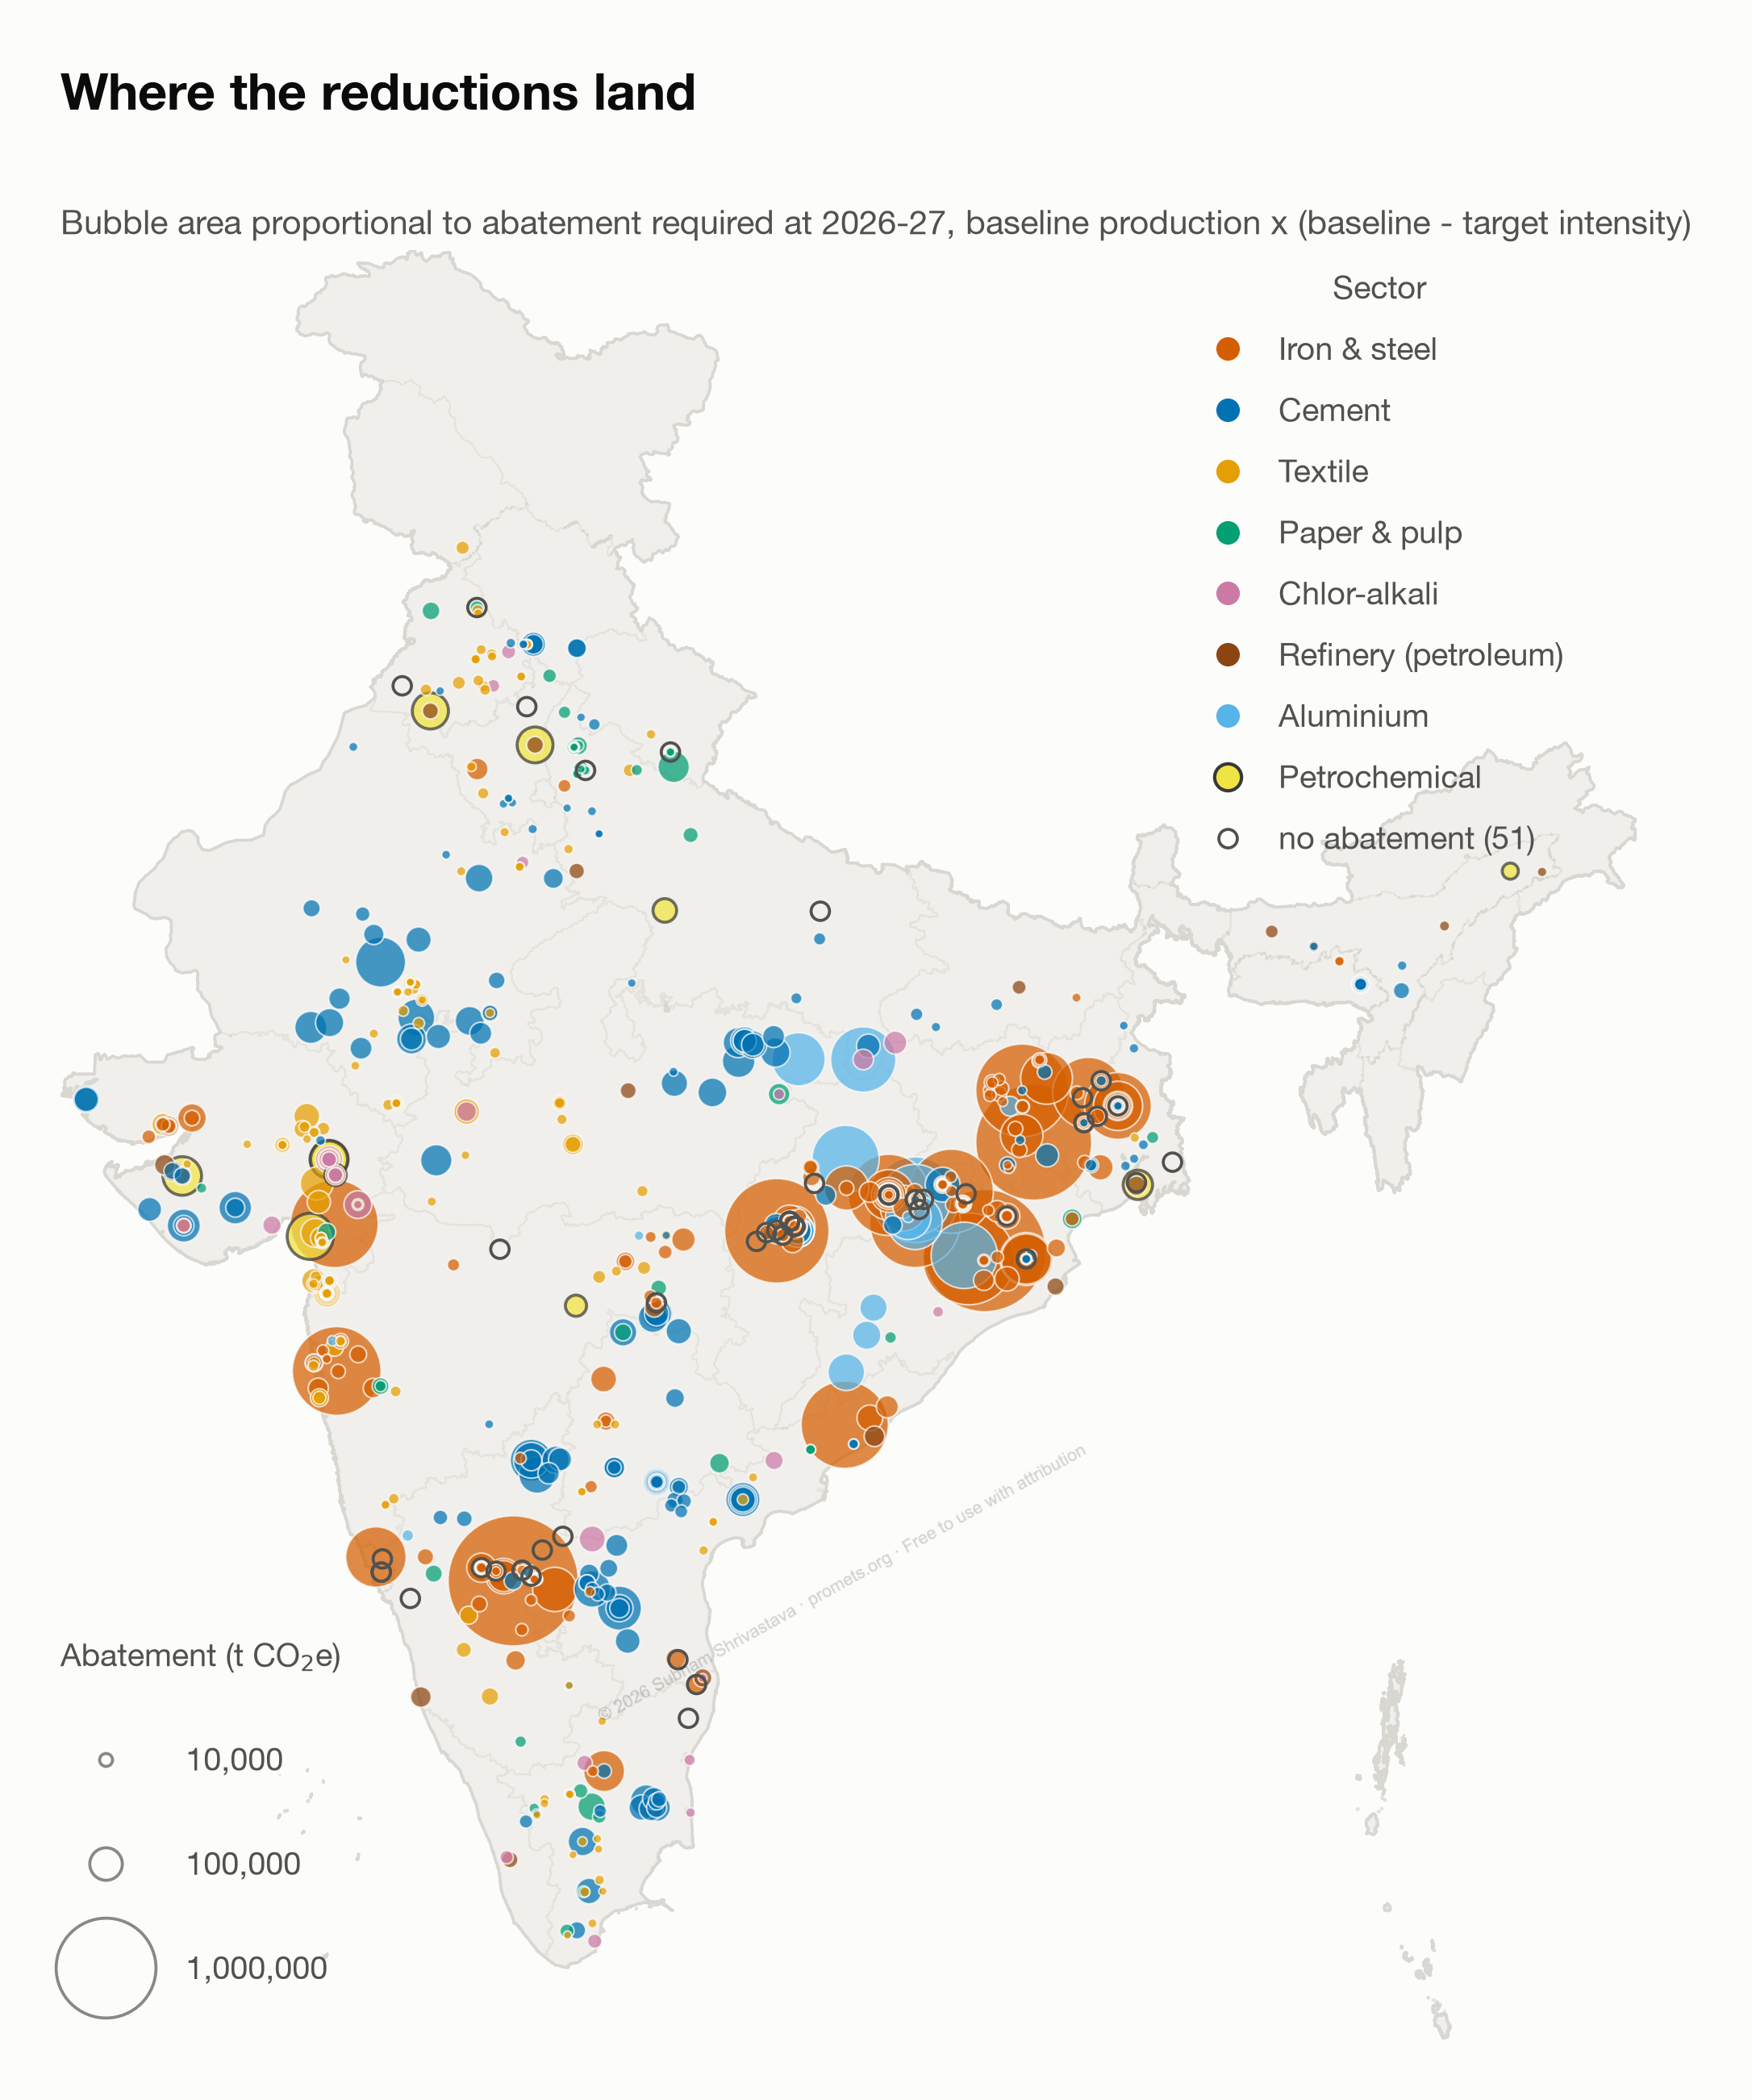
Where the abatement has to happen
Location and emissions are one thing. The cuts required are another.
Here the bubbles show how much abatement each entity has to deliver, that is, what emissions would look like once targets are met.
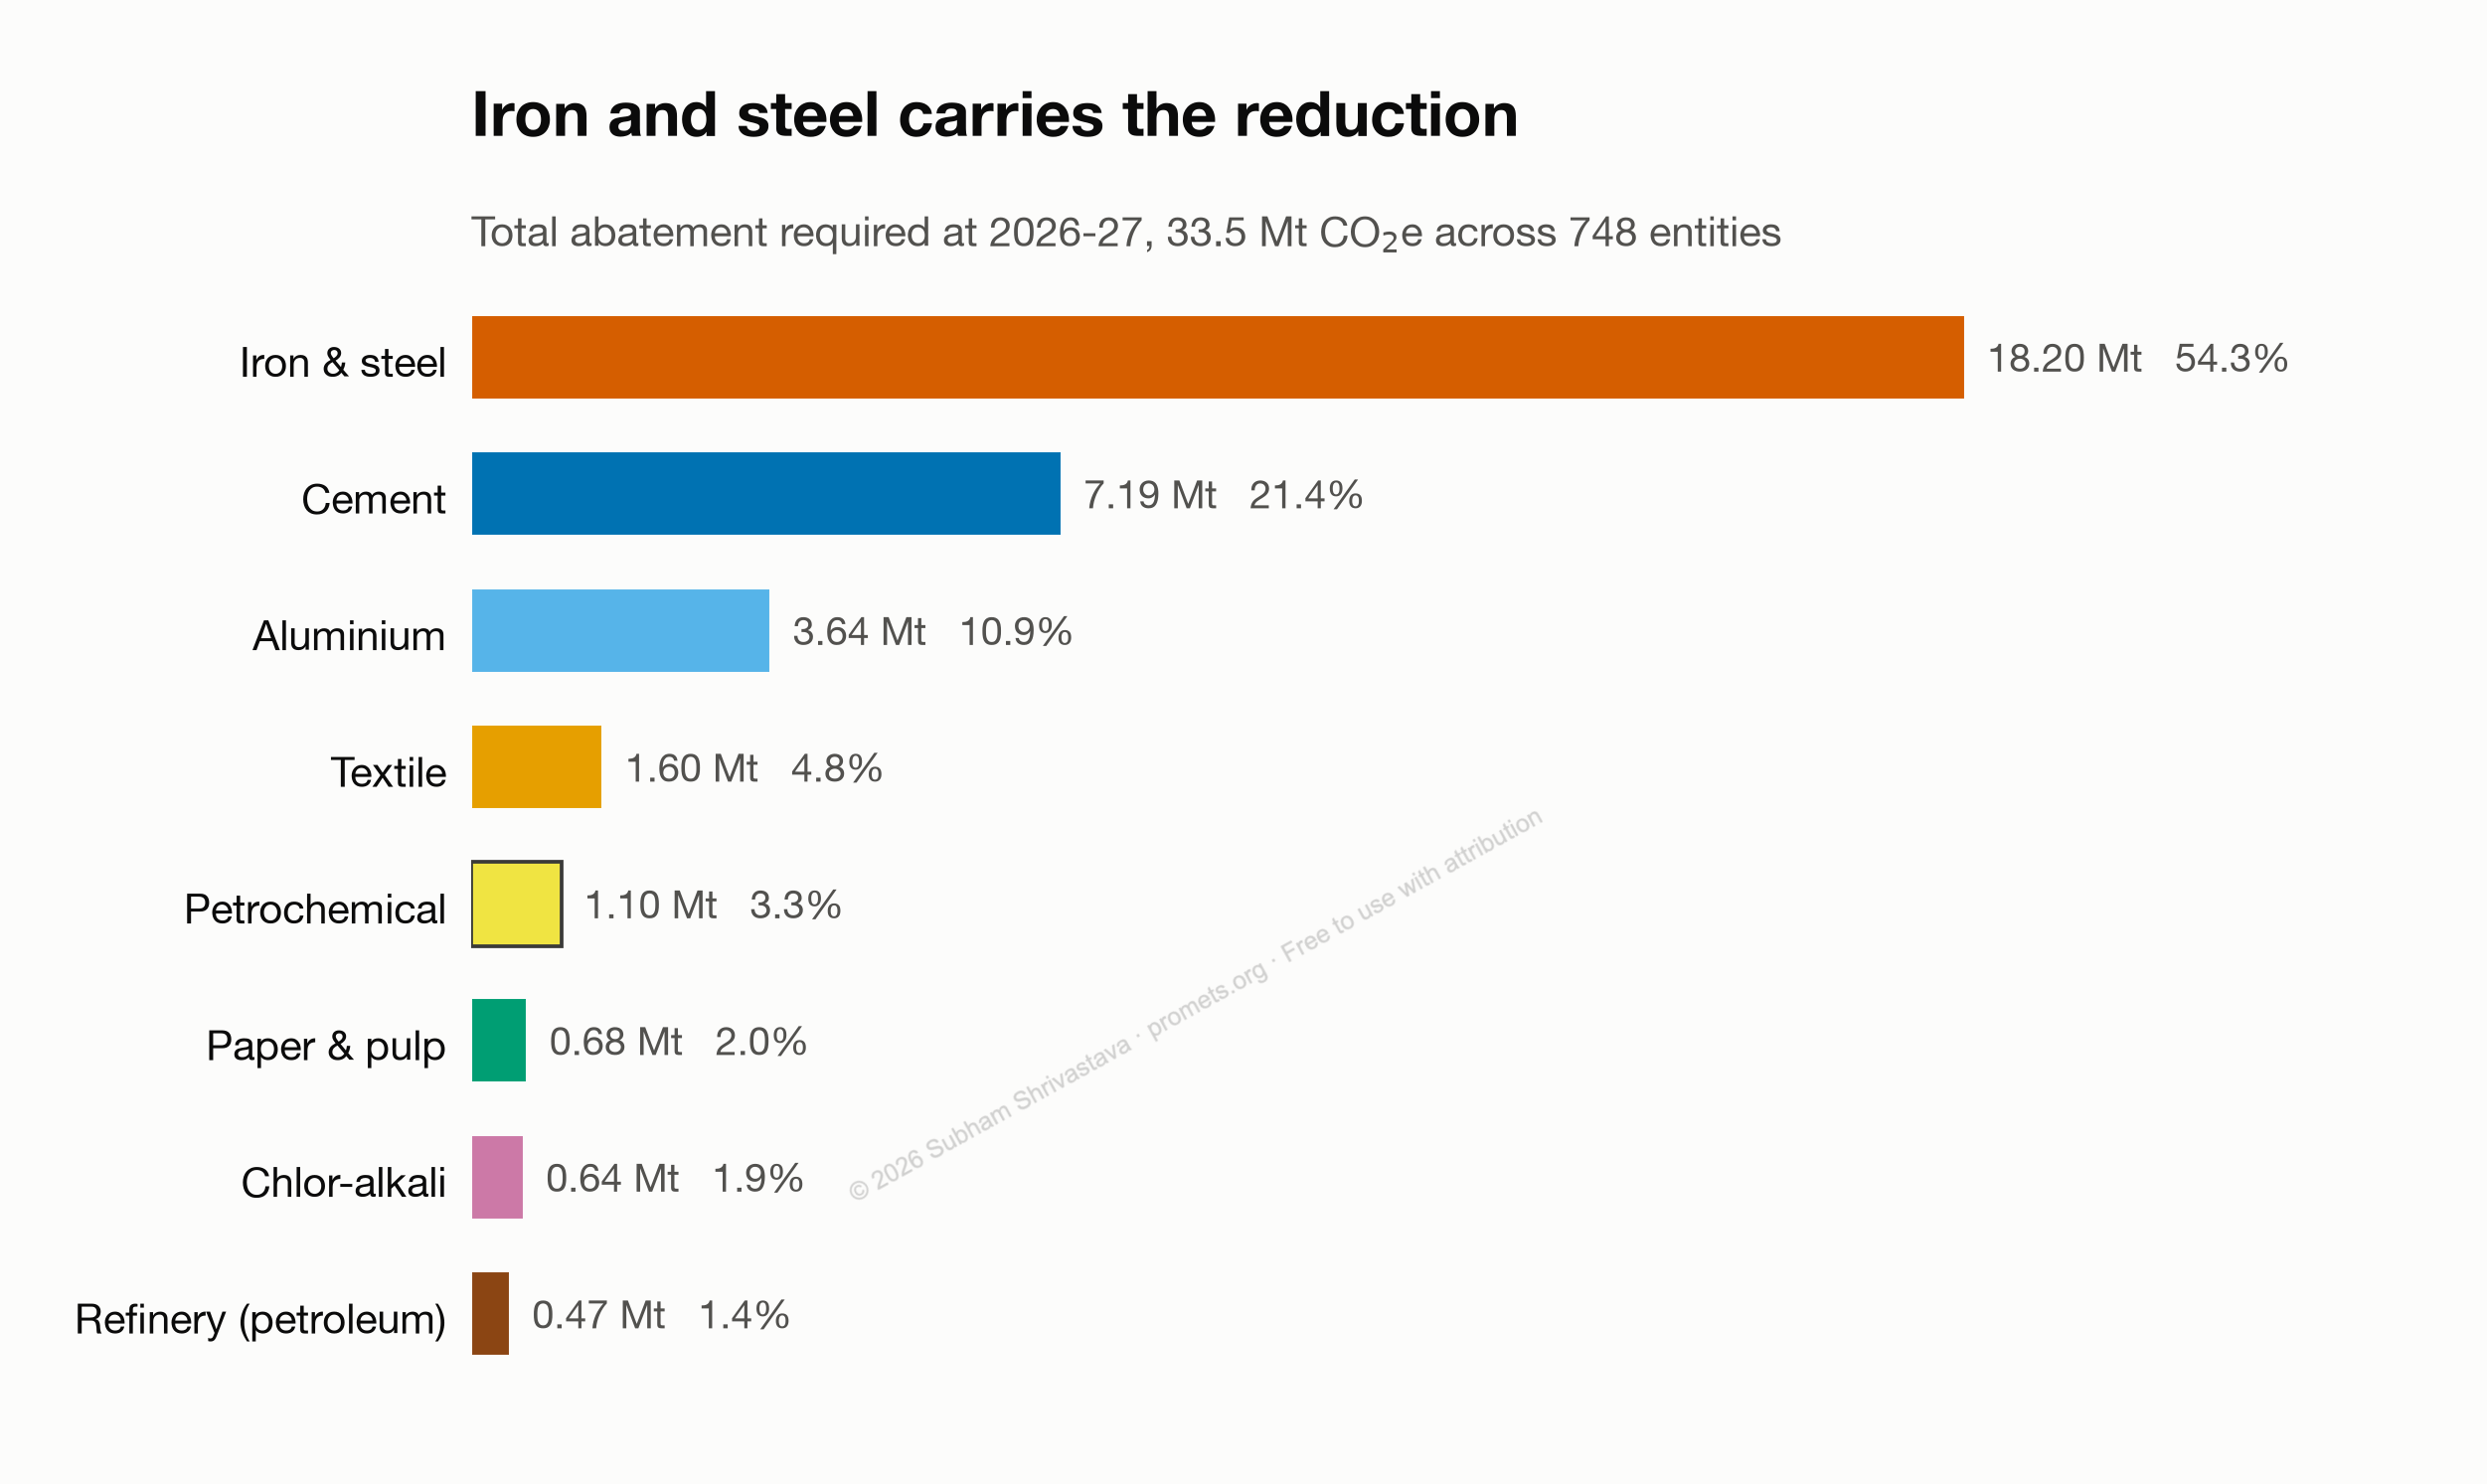
And aggregated by sector: the total abatement required in 2026-27 if each sector meets its targets.
Working with the underlying data
The entity-level dataset behind these maps, including physical locations, is available as a spreadsheet. It is free to use. If you would like a copy, or would like to work together on something with it, email hipromets@gmail.com. I only ask for acknowledgement where it is used.
Frequently asked questions
How many entities are covered by India's CCTS?
Roughly 490 entities across seven sectors have final emission intensity targets notified between October 2025 and January 2026. A draft notification brought iron and steel in as well, a further 255 units, taking the total to over 700 obligated entities.
Which sectors are covered by the CCTS?
Cement, textile, chlor-alkali, pulp and paper, petroleum refining, petrochemicals, and aluminium have final targets. Iron and steel was added at draft stage.
Is India's CCTS a cap-and-trade system?
No. The CCTS is a baseline-and-credit system. Entities are assessed against their own emission intensity target, and credits generated or owed depend on both the intensity gap and the entity's output.
Where are India's carbon market entities located?
Obligated entities are concentrated in industrial clusters rather than spread evenly. The maps above show the distribution weighted by baseline emissions and split by sector.
How much abatement does India's CCTS require?
The abatement required of an entity is the gap between its current emission intensity and its target, applied to its output. Aggregated up, that gives the total emission reductions the 2026-27 targets imply if every sector meets its target, and the sector chart above shows how that total is split between them.
Can I get the entity location data?
Yes. Email hipromets@gmail.com for the spreadsheet. It is free to use with acknowledgement.